
How it works

Continuous network evidence without a lab setup

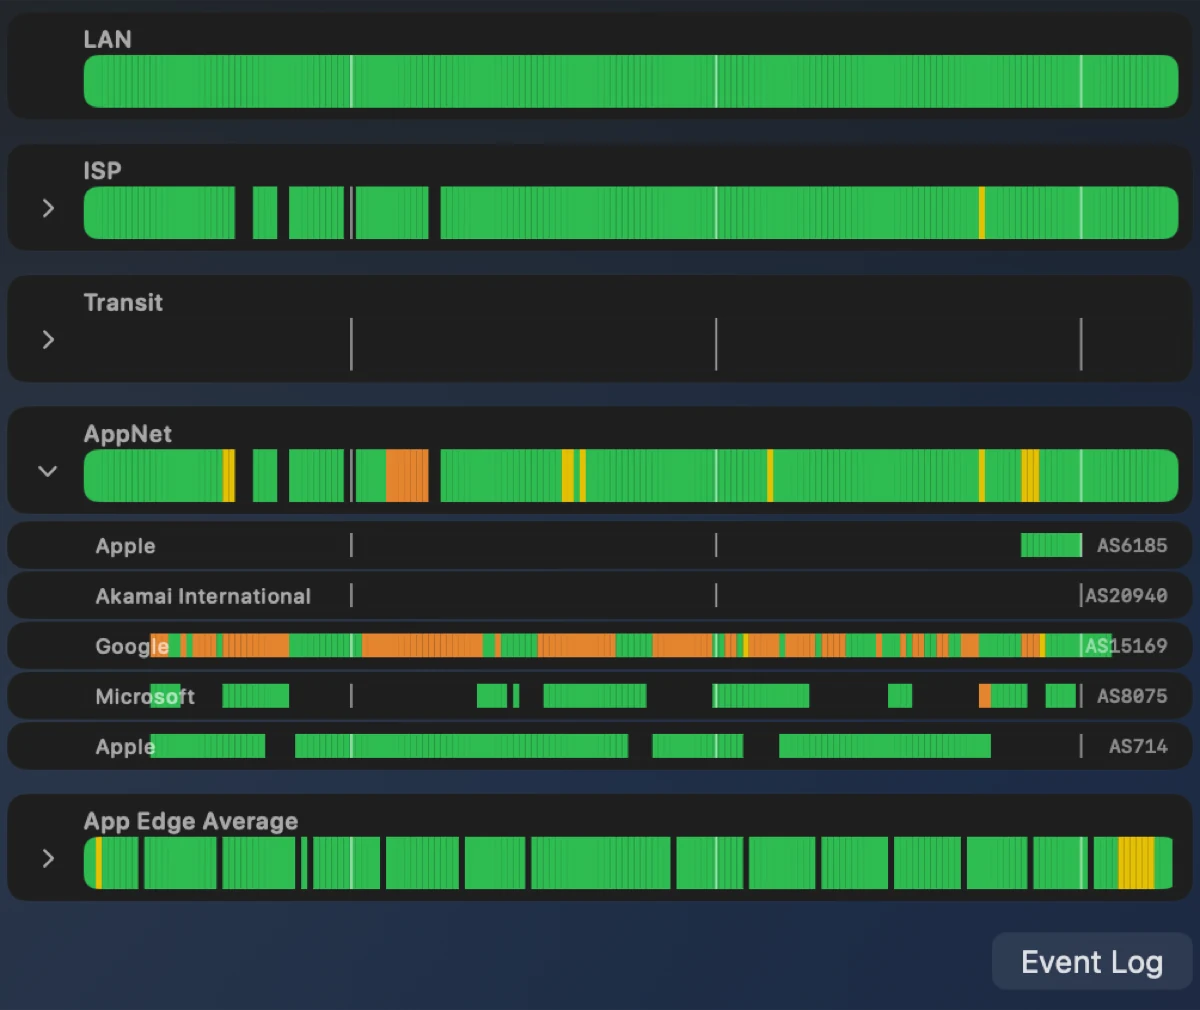
Breakdown watches the apps and services your Mac is already using, keeps compact health history, and separates failures into Wi-Fi/LAN, ISP path, and App so technical users can move straight to the right layer.

Breakdown timeline showing LAN, ISP, Transit, AppNet, and App Edge Average health bands
01

Target selection

Breakdown derives targets from active app traffic, DNS activity, service endpoints, and local network context. That keeps the target set aligned to what you are actually doing instead of a static list of public hosts.

  • Active app endpoints and resolved service names
  • DNS resolvers and local gateway context
  • Frequently used cloud, media, collaboration, and AI services
02

Probe mix

Lightweight checks build a current picture of reachability, latency, loss, jitter, and freshness. Breakdown uses the least intrusive evidence that can answer the question before reaching for deeper diagnostics.

  • DNS and resolver health
  • TCP/UDP reachability and app endpoint checks
  • Path evidence for ISP, transit, and app-side networks
03

Fault attribution

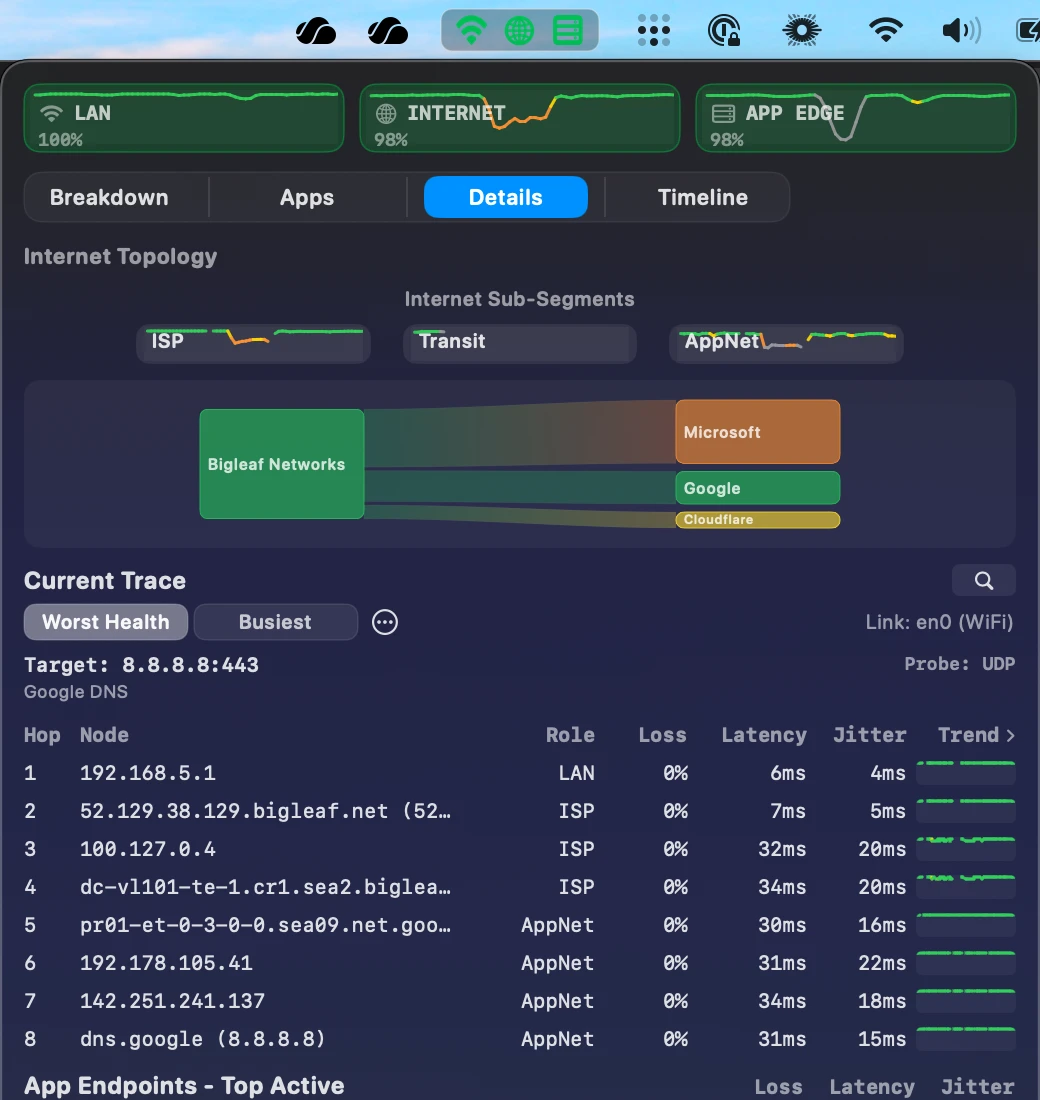
Evidence is grouped by where the problem starts. The main UI keeps the answer simple, while Details and Explorer show the trace, app endpoint, and graph evidence when you need to inspect the underlying signal.

  • Wi-Fi/LAN for local link and gateway symptoms
  • ISP path for last-mile and routed path symptoms
  • App for endpoint, service, and app-side network symptoms
Breakdown Details showing Internet-path and ASN topology, current trace, and app endpoint evidence

Trace and endpoint evidence

What engineers can inspect

When a status light isn’t enough, Details and Explorer expose current trace rows, endpoint health, topology summaries, segment history, and graph views across health, latency, jitter, and shift.

App traffic Probe evidence Timeline Report
Store

Local-first history

Breakdown stores compact local history so intermittent problems remain visible after they pass. Free keeps enough recent history for everyday troubleshooting; Pro expands the depth for recurring incidents and long-running investigation.

Energy

Energy footprint

Breakdown does most of its work in the background and stays quiet when you are not looking at it. In our tests, normal closed-dropdown monitoring typically uses 0.5-1% CPU.

Export

Evidence Reports

Evidence Reports package the useful parts into a support-ready artifact: when the incident happened, which domain looked unhealthy, and what trace or endpoint evidence was visible at the time.

View sample report